

职业杀手
26.53M · 2026-03-25

哈喽啊,小饼好久没发文章了,个人原因最近工作比较繁忙,这段时间也换了新岗位。慢慢腾出一点时间去做巡检工作。
我突然发现一个个去巡检设备好麻烦,突然想到自己弄一个脚本去代替我人工,如果也有想和我一样偷懒的小伙伴,就去和我一样实践起来吧
1、yum install -y ##添加ansible的yum源
2 yum install -y ansible ##安装ansible
mkdir ./ansible ##此时我是在/root/ansible/
ssh-keygen ##获取加密密钥
ssh-copy-id root@serverb ##分发给服务器
ssh-copy-id root@serverc ##分发给服务器
ssh-copy-id root@serverd ##分发给服务器
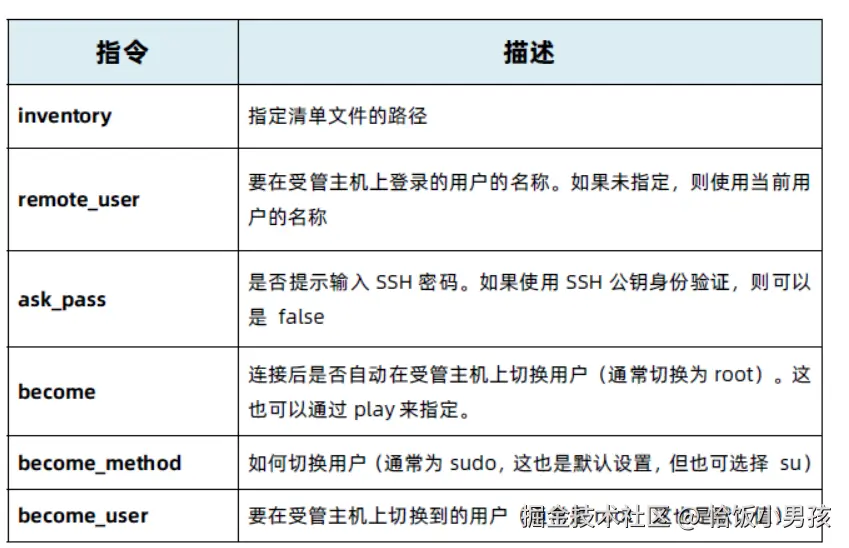
[defaults]
inventory = ./inventory
[privilege_escalation] become = true
become method =sudo
become user = root
become ask pass = true
vim ./inventory
[work]
serverb
serverc
serverd
# ================ SysCheck 2.0 服务器运维巡检脚本 ================
# 作者:yy
# ===============================================================
# --- 基础配置 ---
# 自动检测终端颜色
if [ -t 1 ]; then
RED="�33[91m"
GREEN="�33[92m"
YELLOW="�33[93m"
BLUE="�33[94m"
BOLD="�33[1m"
NC="�33[0m"
else
RED=""; GREEN=""; YELLOW=""; BLUE=""; BOLD=""; NC=""
fi
print_title() {
echo -e "n${BLUE}${BOLD}════════════════════════════════════════════════════════════${NC}"
echo -e "${BOLD} $1${NC}"
echo -e "${BLUE}${BOLD}════════════════════════════════════════════════════════════${NC}"
}
print_status() {
case "$1" in
ok) echo -e "${GREEN} [OK] $2${NC}" ;;
warn) echo -e "${YELLOW} [WARN] $2${NC}" ;;
error) echo -e "${RED} [ERROR] $2${NC}" ;;
info) echo -e "${BLUE} [INFO] $2${NC}" ;;
*) echo -e " [$1] $2" ;;
esac
}
# --- 生成报告文件 ---
generate_report() {
local report_file="/tmp/syscheck_report_$(date +%Y%m%d_%H%M%S).txt"
echo "=== SysCheck 巡检报告 ===" > "$report_file"
echo "生成时间: $(date '+%Y-%m-%d %H:%M:%S')" >> "$report_file"
echo "主机名: $(hostname)" >> "$report_file"
echo "IP地址: $(hostname -I 2>/dev/null | awk '{print $1}')" >> "$report_file"
echo "==================================" >> "$report_file"
}
# --- 1. 系统基础信息 ---
clear
print_title "Linux 服务器深度巡检 (SysCheck 2.0)"
echo -e "巡检时间:$(date '+%Y-%m-%d %H:%M:%S')"
[ -f /etc/os-release ] && . /etc/os-release
OS_NAME="${PRETTY_NAME:-未知}"
HOSTNAME=$(hostname)
KERNEL=$(uname -r)
UPTIME=$(uptime)
LOAD_AVG=$(uptime | awk -F'load average:' '{print $2}' | sed 's/^[ ]*//')
print_status info "系统版本 : $OS_NAME"
print_status info "主机名称 : $HOSTNAME"
print_status info "内核版本 : $KERNEL"
print_status info "运行时间 : $(uptime -p)"
print_status info "平均负载 : $LOAD_AVG"
# --- 2. 资源使用情况 ---
print_title "资源使用情况"
# CPU使用率
CPU_USAGE=$(top -bn1 | grep "Cpu(s)" | awk '{print $2}' | cut -d'%' -f1)
if [ $(echo "$CPU_USAGE > 80" | bc 2>/dev/null || echo "0") = "1" ]; then
print_status error "CPU使用率: ${CPU_USAGE}% - 过高!"
elif [ $(echo "$CPU_USAGE > 60" | bc 2>/dev/null || echo "0") = "1" ]; then
print_status warn "CPU使用率: ${CPU_USAGE}% - 偏高"
else
print_status ok "CPU使用率: ${CPU_USAGE}%"
fi
# 内存
mem_info=$(free -m)
mem_total=$(echo "$mem_info" | awk '/Mem:/ {print $2}')
mem_used=$(echo "$mem_info" | awk '/Mem:/ {print $3}')
mem_free=$(echo "$mem_info" | awk '/Mem:/ {print $4}')
mem_usage=$(echo "scale=2; $mem_used*100/$mem_total" | bc 2>/dev/null || echo "0")
if [ $(echo "$mem_usage > 90" | bc 2>/dev/null || echo "0") = "1" ]; then
print_status error "内存使用: ${mem_usage}% (${mem_used}M/${mem_total}M) - 严重不足!"
elif [ $(echo "$mem_usage > 80" | bc 2>/dev/null || echo "0") = "1" ]; then
print_status warn "内存使用: ${mem_usage}% (${mem_used}M/${mem_total}M) - 偏高"
else
print_status ok "内存使用: ${mem_usage}% (${mem_used}M/${mem_total}M)"
fi
# 交换空间
swap_info=$(free -m | awk '/Swap:/')
if [ -n "$swap_info" ]; then
swap_total=$(echo "$swap_info" | awk '{print $2}')
swap_used=$(echo "$swap_info" | awk '{print $3}')
if [ "$swap_total" -gt 0 ]; then
swap_usage=$(echo "scale=2; $swap_used*100/$swap_total" | bc 2>/dev/null || echo "0")
if [ "$swap_used" -gt 0 ]; then
print_status warn "交换空间使用: ${swap_usage}% (${swap_used}M/${swap_total}M)"
fi
fi
fi
# 磁盘检查
print_status info "磁盘使用情况:"
df -hT | grep -vE 'tmpfs|cdrom|loop|overlay|squashfs|udev|devtmpfs' | while read fs type size used avail use mount; do
if [ -n "$use" ]; then
usage_num=$(echo "$use" | tr -d '%')
if [ "$usage_num" -ge 95 ]; then
print_status error " $mount ($use) - ${size}已用${used} - 空间严重不足!"
elif [ "$usage_num" -ge 85 ]; then
print_status warn " $mount ($use) - ${size}已用${used} - 空间不足"
elif [ "$usage_num" -ge 70 ]; then
print_status info " $mount ($use) - ${size}已用${used}"
else
print_status ok " $mount ($use) - ${size}已用${used}"
fi
fi
done
# Inode检查
print_status info "Inode使用情况:"
df -i | grep -vE 'tmpfs|cdrom|loop|overlay|squashfs|udev|devtmpfs' | while read fs inodes iused ifree iuse mount; do
if [ -n "$iuse" ] && [ "$iuse" != "IUse%" ]; then
iuse_num=$(echo "$iuse" | tr -d '%')
if [ "$iuse_num" -ge 90 ]; then
print_status error " $mount ($iuse) - Inode接近耗尽!"
elif [ "$iuse_num" -ge 80 ]; then
print_status warn " $mount ($iuse) - Inode使用较高"
fi
fi
done
# --- 3. 安全补丁检查 (修复增强版) ---
print_title "安全补丁与漏洞检查"
check_updates() {
if command -v apt >/dev/null 2>&1; then
# Debian/Ubuntu 逻辑
if updates=$(apt list --upgradable 2>/dev/null | grep -v "Listing..."); then
cnt=$(echo "$updates" | wc -l)
if [ "$cnt" -gt 0 ]; then
print_status warn "发现 $cnt 个可升级包"
echo "$updates" | head -n 5 | while read line; do
echo " $line"
done
[ "$cnt" -gt 5 ] && echo " ... (还有 $((cnt-5)) 个未显示)"
else
print_status ok "系统软件包已是最新"
fi
fi
elif command -v dnf >/dev/null 2>&1 || command -v yum >/dev/null 2>&1; then
# RHEL/CentOS/Rocky 逻辑
PKG_MGR=$(command -v dnf || command -v yum)
# 检查安全更新
if $PKG_MGR check-update --security >/dev/null 2>&1; then
sec_count=$($PKG_MGR check-update --security 2>/dev/null | grep -c "..")
if [ "$sec_count" -gt 0 ]; then
print_status warn "发现 $sec_count 个安全补丁待安装!"
$PKG_MGR check-update --security 2>/dev/null | head -n 5
[ "$sec_count" -gt 5 ] && echo " ... (还有 $((sec_count-5)) 个未显示)"
else
print_status ok "未发现严重安全补丁"
fi
else
# 尝试其他方法
if sec_info=$($PKG_MGR updateinfo list security 2>/dev/null); then
sec_count=$(echo "$sec_info" | grep -c "security" || echo 0)
if [ "$sec_count" -gt 0 ]; then
print_status warn "发现 $sec_count 个安全补丁待安装!"
echo "$sec_info" | head -n 5
else
print_status ok "未发现严重安全补丁"
fi
else
print_status info "跳过安全检查:当前源不支持元数据查询或缺少插件"
fi
fi
else
print_status info "未知包管理器,跳过补丁检查"
fi
}
check_updates
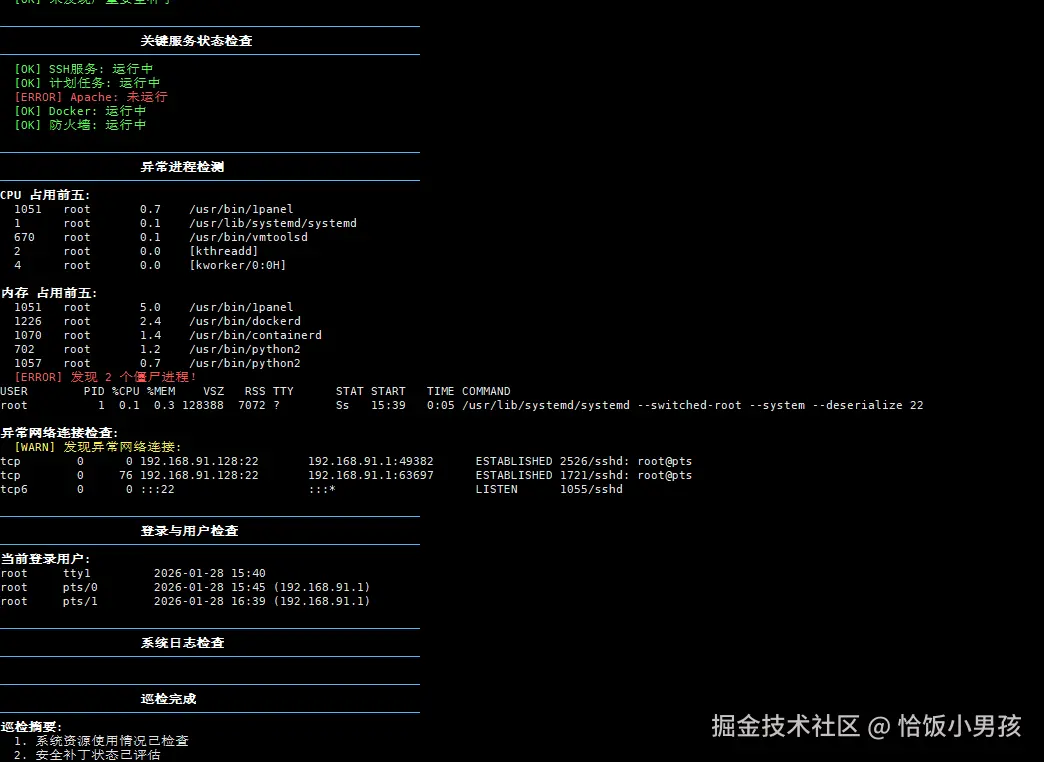
# --- 4. 服务状态检查 ---
print_title "关键服务状态检查"
check_service() {
local service=$1
local name=$2
if systemctl list-unit-files | grep -q "^${service}.service"; then
if systemctl is-active --quiet "$service"; then
print_status ok "$name: 运行中"
else
print_status error "$name: 未运行"
fi
fi
}
# 检查常见服务
check_service "sshd" "SSH服务"
check_service "crond" "计划任务"
check_service "nginx" "Nginx"
check_service "httpd" "Apache"
check_service "mysqld" "MySQL"
check_service "postgresql" "PostgreSQL"
check_service "docker" "Docker"
check_service "firewalld" "防火墙"
check_service "iptables" "iptables"
check_service "fail2ban" "Fail2ban"
# --- 5. 异常检测 ---
print_title "异常进程检测"
# 高负载进程
echo -e "${BOLD}CPU 占用前五:${NC}"
ps -eo pid,user,%cpu,cmd --sort=-%cpu | head -n 6 | tail -n 5 | awk '{printf " %-6s %-10s %-6s %sn", $1, $2, $3, $4}'
echo -e "n${BOLD}内存 占用前五:${NC}"
ps -eo pid,user,%mem,cmd --sort=-%mem | head -n 6 | tail -n 5 | awk '{printf " %-6s %-10s %-6s %sn", $1, $2, $3, $4}'
# 僵尸进程
zombies=$(ps aux | grep -E "[Zz]" | grep -v grep | wc -l)
if [ "$zombies" -gt 0 ]; then
print_status error "发现 $zombies 个僵尸进程!"
ps aux | grep -E "[Zz]" | grep -v grep
else
print_status ok "无僵尸进程"
fi
# 检查异常连接
echo -e "n${BOLD}异常网络连接检查:${NC}"
if command -v netstat >/dev/null 2>&1; then
suspicious=$(netstat -antp 2>/dev/null | grep -E "LISTEN|ESTABLISHED" | grep -vE "127.0.0.1|::1|0.0.0.0" | head -n 10)
if [ -n "$suspicious" ]; then
print_status warn "发现异常网络连接:"
echo "$suspicious" | head -n 5
fi
fi
# --- 6. 登录和用户检查 ---
print_title "登录与用户检查"
# 当前登录用户
echo -e "${BOLD}当前登录用户:${NC}"
who | head -n 5
# 检查空密码用户
if [ -f /etc/shadow ]; then
empty_pass=$(sudo awk -F: '($2 == "" || $2 == "!") {print $1}' /etc/shadow 2>/dev/null || echo "")
if [ -n "$empty_pass" ]; then
print_status error "发现空密码用户: $empty_pass"
fi
fi
# 检查root用户远程登录
if grep -q "^PermitRootLogin yes" /etc/ssh/sshd_config 2>/dev/null; then
print_status warn "SSH配置允许root远程登录"
fi
# --- 7. 系统日志检查 ---
print_title "系统日志检查"
# 检查最近错误日志
if [ -f /var/log/messages ]; then
recent_errors=$(tail -n 20 /var/log/messages | grep -i "error|fail|critical" | head -n 5)
elif [ -f /var/log/syslog ]; then
recent_errors=$(tail -n 20 /var/log/syslog | grep -i "error|fail|critical" | head -n 5)
fi
if [ -n "$recent_errors" ]; then
print_status warn "最近系统日志错误:"
echo "$recent_errors" | while read line; do
echo " $line"
done
fi
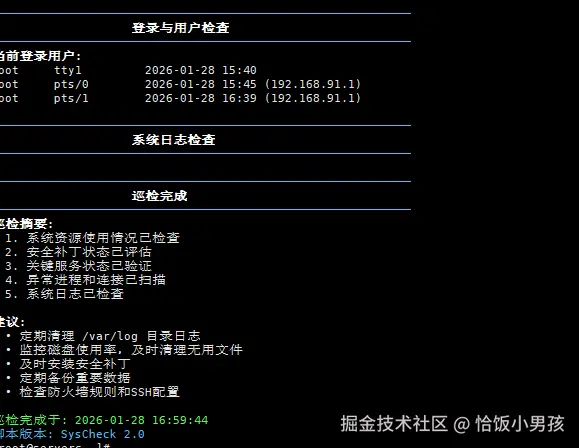
# --- 8. 结束与建议 ---
print_title "巡检完成"
echo -e "${BOLD}巡检摘要:${NC}"
echo -e " 1. 系统资源使用情况已检查"
echo -e " 2. 安全补丁状态已评估"
echo -e " 3. 关键服务状态已验证"
echo -e " 4. 异常进程和连接已扫描"
echo -e " 5. 系统日志已检查"
echo -e "n${BOLD}建议:${NC}"
echo -e " • 定期清理 /var/log 目录日志"
echo -e " • 监控磁盘使用率,及时清理无用文件"
echo -e " • 及时安装安全补丁"
echo -e " • 定期备份重要数据"
echo -e " • 检查防火墙规则和SSH配置"
echo -e "n${GREEN}巡检完成于: $(date '+%Y-%m-%d %H:%M:%S')${NC}"
echo -e "${BLUE}脚本版本: SysCheck 2.0${NC}"
1、yum install epel
2、yum install -y phthon3
vim syscheck-excel.py
# -*- coding: utf-8 -*-
# ==============================================================================
# 脚本名称: syscheck-excel.py (Pro版)
# 功能描述: 采集Linux系统信息、磁盘、Top进程,生成带样式的美观Excel报表
# 运行方式: chmod +x syscheck-excel.py && ./syscheck-excel.py
# 依赖库 : pip3 install psutil pandas openpyxl
# 作者 :yy
# ==============================================================================
import os
import sys
import socket
import datetime
import platform
import subprocess
# 依赖库检查
try:
import psutil
import pandas as pd
from openpyxl import Workbook
from openpyxl.styles import Font, PatternFill, Border, Side, Alignment
from openpyxl.utils import get_column_letter
except ImportError as e:
print("[Error] 缺少必要模块:", e)
print("请先执行安装: pip3 install psutil pandas openpyxl")
sys.exit(1)
def get_size(bytes_num, suffix="B"):
"""人性化显示文件大小"""
factor = 1024
for unit in ["", "K", "M", "G", "T", "P"]:
if bytes_num < factor:
return f"{bytes_num:.2f}{unit}{suffix}"
bytes_num /= factor
return f"{bytes_num:.2f}EB"
def get_process_info():
"""获取CPU和内存占用最高的Top 10进程"""
procs = []
for p in psutil.process_iter(['pid', 'name', 'username', 'cpu_percent', 'memory_percent']):
try:
procs.append(p.info)
except (psutil.NoSuchProcess, psutil.AccessDenied, psutil.ZombieProcess):
pass
# 转为DataFrame
if procs:
df_proc = pd.DataFrame(procs)
if not df_proc.empty:
# 按内存使用率排序取Top 10
df_proc = df_proc.sort_values(by='memory_percent', ascending=False).head(10)
df_proc['cpu_percent'] = df_proc['cpu_percent'].apply(lambda x: f"{x:.1f}%" if x else "0.0%")
df_proc['memory_percent'] = df_proc['memory_percent'].apply(lambda x: f"{x:.1f}%" if x else "0.0%")
df_proc.columns = ['PID', 'Process', 'User', 'CPU%', 'Memory%']
return df_proc
return pd.DataFrame()
def get_system_info():
"""获取详细的系统信息"""
info = {}
# 基本系统信息
uname = platform.uname()
info['System'] = uname.system
info['Hostname'] = uname.node
info['Release'] = uname.release
info['Version'] = uname.version
info['Machine'] = uname.machine
info['Processor'] = uname.processor
# 获取发行版详细信息
if os.path.exists('/etc/os-release'):
with open('/etc/os-release', 'r') as f:
for line in f:
if 'PRETTY_NAME' in line:
info['OS Name'] = line.split('=', 1)[1].strip().strip('"')
break
# CPU信息
info['CPU Cores (Logical)'] = psutil.cpu_count(logical=True)
info['CPU Cores (Physical)'] = psutil.cpu_count(logical=False)
# 内存信息
mem = psutil.virtual_memory()
info['Total Memory'] = get_size(mem.total)
info['Available Memory'] = get_size(mem.available)
info['Memory Usage %'] = f"{mem.percent}%"
# 启动时间
boot_time = datetime.datetime.fromtimestamp(psutil.boot_time())
info['Boot Time'] = boot_time.strftime("%Y-%m-%d %H:%M:%S")
# 运行时间
uptime = datetime.datetime.now() - boot_time
days = uptime.days
hours, remainder = divmod(uptime.seconds, 3600)
minutes, seconds = divmod(remainder, 60)
info['Uptime'] = f"{days}d {hours}h {minutes}m {seconds}s"
# 负载
if hasattr(os, 'getloadavg'):
load = os.getloadavg()
info['Load 1min'] = f"{load[0]:.2f}"
info['Load 5min'] = f"{load[1]:.2f}"
info['Load 15min'] = f"{load[2]:.2f}"
# CPU使用率
cpu_percent = psutil.cpu_percent(interval=1)
info['CPU Usage %'] = f"{cpu_percent}%"
return info
def get_network_info():
"""获取网络信息"""
network_info = {}
try:
# 获取IP地址
hostname = socket.gethostname()
try:
ip_address = socket.gethostbyname(hostname)
except:
ip_address = "Unknown"
network_info['Hostname'] = hostname
network_info['IP Address'] = ip_address
# 网络接口信息
interfaces = []
for interface, addrs in psutil.net_if_addrs().items():
for addr in addrs:
if addr.family == socket.AF_INET: # IPv4
interfaces.append({
'Interface': interface,
'Address': addr.address,
'Netmask': addr.netmask
})
network_info['Interfaces'] = interfaces
# IO统计
net_io = psutil.net_io_counters()
network_info['Bytes Sent'] = get_size(net_io.bytes_sent)
network_info['Bytes Received'] = get_size(net_io.bytes_recv)
except Exception as e:
network_info['Error'] = f"获取网络信息失败: {str(e)}"
return network_info
def get_disk_info():
"""获取磁盘信息"""
disk_list = []
try:
for partition in psutil.disk_partitions():
# 跳过特殊文件系统
skip = False
for skip_str in ['loop', 'snap', 'docker', 'overlay', 'tmpfs']:
if skip_str in partition.device.lower() or skip_str in partition.mountpoint.lower():
skip = True
break
if skip:
continue
try:
usage = psutil.disk_usage(partition.mountpoint)
disk_list.append({
'Device': partition.device,
'Mount Point': partition.mountpoint,
'File System': partition.fstype,
'Total Size': get_size(usage.total),
'Used': get_size(usage.used),
'Free': get_size(usage.free),
'Usage %': f"{usage.percent}%",
'Percent': usage.percent
})
except (PermissionError, OSError):
continue
# 按使用率排序
if disk_list:
disk_list.sort(key=lambda x: x['Percent'], reverse=True)
except Exception as e:
print(f"获取磁盘信息失败: {e}")
return disk_list
def get_service_status():
"""获取服务状态"""
services = []
# 常见服务列表
common_services = [
'sshd', 'crond', 'rsyslog', 'network', 'firewalld',
'nginx', 'httpd', 'mysql', 'postgresql', 'docker'
]
for service in common_services:
status = 'Unknown'
try:
# 尝试systemctl
result = subprocess.run(['systemctl', 'is-active', service],
capture_output=True, text=True, timeout=2)
if result.returncode == 0:
status = result.stdout.strip()
else:
# 尝试service命令
result = subprocess.run(['service', service, 'status'],
capture_output=True, text=True, timeout=2)
status = 'active' if result.returncode == 0 else 'inactive'
except subprocess.TimeoutExpired:
status = 'timeout'
except FileNotFoundError:
status = 'not installed'
except:
status = 'error'
services.append({'Service': service, 'Status': status})
return services
def create_summary_sheet(workbook, system_info, network_info):
"""创建汇总sheet"""
ws = workbook.create_sheet("System Summary")
# 标题
ws.merge_cells('A1:B1')
ws['A1'] = "System Inspection Report"
ws['A1'].font = Font(size=14, bold=True, color="366092")
ws['A1'].alignment = Alignment(horizontal='center')
ws['A2'] = f"Report Time: {datetime.datetime.now().strftime('%Y-%m-%d %H:%M:%S')}"
ws['A3'] = f"Hostname: {network_info.get('Hostname', 'Unknown')}"
ws['A4'] = f"IP Address: {network_info.get('IP Address', 'Unknown')}"
# 系统信息表格
row = 6
ws[f'A{row}'] = "System Information"
ws[f'A{row}'].font = Font(bold=True)
row += 1
sys_keys = ['OS Name', 'System', 'Release', 'Version', 'Machine',
'Processor', 'CPU Cores (Logical)', 'CPU Cores (Physical)',
'Total Memory', 'Memory Usage %', 'CPU Usage %',
'Boot Time', 'Uptime']
for key in sys_keys:
if key in system_info:
ws[f'A{row}'] = key
ws[f'B{row}'] = system_info[key]
row += 1
# 负载信息
if 'Load 1min' in system_info:
row += 1
ws[f'A{row}'] = "System Load"
ws[f'A{row}'].font = Font(bold=True)
row += 1
ws[f'A{row}'] = "1 Minute"
ws[f'B{row}'] = system_info['Load 1min']
row += 1
ws[f'A{row}'] = "5 Minutes"
ws[f'B{row}'] = system_info['Load 5min']
row += 1
ws[f'A{row}'] = "15 Minutes"
ws[f'B{row}'] = system_info['Load 15min']
# 调整列宽
ws.column_dimensions['A'].width = 25
ws.column_dimensions['B'].width = 40
def create_disk_sheet(workbook, disk_info):
"""创建磁盘信息sheet"""
if not disk_info:
return
# 转换为DataFrame
df_disk = pd.DataFrame(disk_info)
# 移除Percent列(仅用于排序)
if 'Percent' in df_disk.columns:
df_disk = df_disk.drop('Percent', axis=1)
# 创建sheet
ws = workbook.create_sheet("Disk Usage")
ws.title = "Disk Usage"
# 写入数据
for r_idx, row in enumerate(df_disk.iterrows(), start=1):
for c_idx, value in enumerate(row[1], start=1):
cell = ws.cell(row=r_idx+1, column=c_idx, value=value)
# 写入表头
for c_idx, col_name in enumerate(df_disk.columns, start=1):
cell = ws.cell(row=1, column=c_idx, value=col_name)
# 应用样式
header_fill = PatternFill(start_color="4F81BD", end_color="4F81BD", fill_type="solid")
header_font = Font(color="FFFFFF", bold=True)
thin_border = Border(left=Side(style='thin'), right=Side(style='thin'),
top=Side(style='thin'), bottom=Side(style='thin'))
align_center = Alignment(horizontal='center', vertical='center')
# 设置表头样式
for cell in ws[1]:
cell.fill = header_fill
cell.font = header_font
cell.alignment = align_center
cell.border = thin_border
# 设置数据样式和高亮
for row in ws.iter_rows(min_row=2, max_row=ws.max_row):
for cell in row:
cell.border = thin_border
cell.alignment = align_center
# 高亮使用率
if cell.column == 7 and cell.value: # 第7列是Usage %
try:
val_str = str(cell.value).strip('%')
val = float(val_str)
if val >= 90:
cell.font = Font(color="FF0000", bold=True)
elif val >= 80:
cell.font = Font(color="FFA500", bold=True)
except ValueError:
pass
# 调整列宽
for col in ws.columns:
max_length = 0
col_letter = get_column_letter(col[0].column)
for cell in col:
if cell.value and len(str(cell.value)) > max_length:
max_length = len(str(cell.value))
adjusted_width = min(max_length + 2, 30)
ws.column_dimensions[col_letter].width = adjusted_width
def create_service_sheet(workbook, services):
"""创建服务状态sheet"""
if not services:
return
df_services = pd.DataFrame(services)
# 创建sheet
ws = workbook.create_sheet("Service Status")
# 写入数据
for r_idx, row in enumerate(df_services.iterrows(), start=1):
for c_idx, value in enumerate(row[1], start=1):
cell = ws.cell(row=r_idx+1, column=c_idx, value=value)
# 写入表头
for c_idx, col_name in enumerate(df_services.columns, start=1):
cell = ws.cell(row=1, column=c_idx, value=col_name)
# 应用样式
header_fill = PatternFill(start_color="4F81BD", end_color="4F81BD", fill_type="solid")
header_font = Font(color="FFFFFF", bold=True)
thin_border = Border(left=Side(style='thin'), right=Side(style='thin'),
top=Side(style='thin'), bottom=Side(style='thin'))
align_center = Alignment(horizontal='center', vertical='center')
# 设置表头样式
for cell in ws[1]:
cell.fill = header_fill
cell.font = header_font
cell.alignment = align_center
cell.border = thin_border
# 设置数据样式和高亮
for row in ws.iter_rows(min_row=2, max_row=ws.max_row):
for cell in row:
cell.border = thin_border
cell.alignment = align_center
# 高亮状态
if cell.column == 2 and cell.value: # 第2列是状态
status = str(cell.value).lower()
if status == 'active':
cell.fill = PatternFill(start_color="C6EFCE", end_color="C6EFCE", fill_type="solid")
elif status in ['inactive', 'failed', 'error']:
cell.fill = PatternFill(start_color="FFC7CE", end_color="FFC7CE", fill_type="solid")
cell.font = Font(color="FF0000", bold=True)
# 调整列宽
ws.column_dimensions['A'].width = 20
ws.column_dimensions['B'].width = 15
def create_process_sheet(workbook, process_info):
"""创建进程信息sheet"""
if process_info.empty:
return
# 创建sheet
ws = workbook.create_sheet("Top Processes")
# 写入数据
for r_idx, row in enumerate(process_info.iterrows(), start=1):
for c_idx, value in enumerate(row[1], start=1):
cell = ws.cell(row=r_idx+1, column=c_idx, value=value)
# 写入表头
for c_idx, col_name in enumerate(process_info.columns, start=1):
cell = ws.cell(row=1, column=c_idx, value=col_name)
# 应用样式
header_fill = PatternFill(start_color="4F81BD", end_color="4F81BD", fill_type="solid")
header_font = Font(color="FFFFFF", bold=True)
thin_border = Border(left=Side(style='thin'), right=Side(style='thin'),
top=Side(style='thin'), bottom=Side(style='thin'))
align_center = Alignment(horizontal='center', vertical='center')
# 设置表头样式
for cell in ws[1]:
cell.fill = header_fill
cell.font = header_font
cell.alignment = align_center
cell.border = thin_border
# 设置数据样式
for row in ws.iter_rows(min_row=2, max_row=ws.max_row):
for cell in row:
cell.border = thin_border
cell.alignment = align_center
# 调整列宽
for col in ws.columns:
max_length = 0
col_letter = get_column_letter(col[0].column)
for cell in col:
if cell.value and len(str(cell.value)) > max_length:
max_length = len(str(cell.value))
adjusted_width = min(max_length + 2, 30)
ws.column_dimensions[col_letter].width = adjusted_width
def create_network_sheet(workbook, network_info):
"""创建网络信息sheet"""
ws = workbook.create_sheet("Network Info")
# 标题
ws['A1'] = "Network Information"
ws['A1'].font = Font(size=12, bold=True)
row = 3
ws[f'A{row}'] = "Hostname"
ws[f'B{row}'] = network_info.get('Hostname', 'Unknown')
row += 1
ws[f'A{row}'] = "IP Address"
ws[f'B{row}'] = network_info.get('IP Address', 'Unknown')
row += 1
# 网络统计
ws[f'A{row}'] = "Bytes Sent"
ws[f'B{row}'] = network_info.get('Bytes Sent', 'Unknown')
row += 1
ws[f'A{row}'] = "Bytes Received"
ws[f'B{row}'] = network_info.get('Bytes Received', 'Unknown')
# 网络接口
if 'Interfaces' in network_info and network_info['Interfaces']:
row += 2
ws[f'A{row}'] = "Network Interfaces"
ws[f'A{row}'].font = Font(bold=True)
row += 1
# 表头
headers = ['Interface', 'IP Address', 'Netmask']
for col, header in enumerate(headers, 1):
cell = ws.cell(row=row, column=col, value=header)
cell.fill = PatternFill(start_color="4F81BD", end_color="4F81BD", fill_type="solid")
cell.font = Font(color="FFFFFF", bold=True)
row += 1
# 数据
for interface in network_info['Interfaces'][:10]: # 限制显示数量
ws.cell(row=row, column=1, value=interface.get('Interface', ''))
ws.cell(row=row, column=2, value=interface.get('Address', ''))
ws.cell(row=row, column=3, value=interface.get('Netmask', ''))
row += 1
# 设置边框和样式
thin_border = Border(left=Side(style='thin'), right=Side(style='thin'),
top=Side(style='thin'), bottom=Side(style='thin'))
for row_cells in ws.iter_rows(min_row=1, max_row=ws.max_row, max_col=4):
for cell in row_cells:
cell.border = thin_border
if cell.row > 1:
cell.alignment = Alignment(horizontal='left', vertical='center')
# 调整列宽
ws.column_dimensions['A'].width = 20
ws.column_dimensions['B'].width = 25
ws.column_dimensions['C'].width = 20
def sys_check_excel():
"""主函数"""
print(f"[{datetime.datetime.now().strftime('%H:%M:%S')}] Starting system inspection...")
# 收集信息
print("Collecting system information...")
system_info = get_system_info()
print("Collecting network information...")
network_info = get_network_info()
print("Checking disk usage...")
disk_info = get_disk_info()
print("Checking service status...")
services = get_service_status()
print("Analyzing processes...")
process_info = get_process_info()
# 生成Excel文件名
hostname = system_info.get('Hostname', 'unknown')
timestamp = datetime.datetime.now().strftime('%Y%m%d_%H%M%S')
filename = f"system_inspection_{hostname}_{timestamp}.xlsx"
print(f"Generating Excel report: {filename}")
try:
# 创建Excel工作簿
wb = Workbook()
# 移除默认的sheet
if 'Sheet' in wb.sheetnames:
default_ws = wb['Sheet']
wb.remove(default_ws)
# 创建各个sheet
create_summary_sheet(wb, system_info, network_info)
create_disk_sheet(wb, disk_info)
create_service_sheet(wb, services)
create_network_sheet(wb, network_info)
create_process_sheet(wb, process_info)
# 保存文件
wb.save(filename)
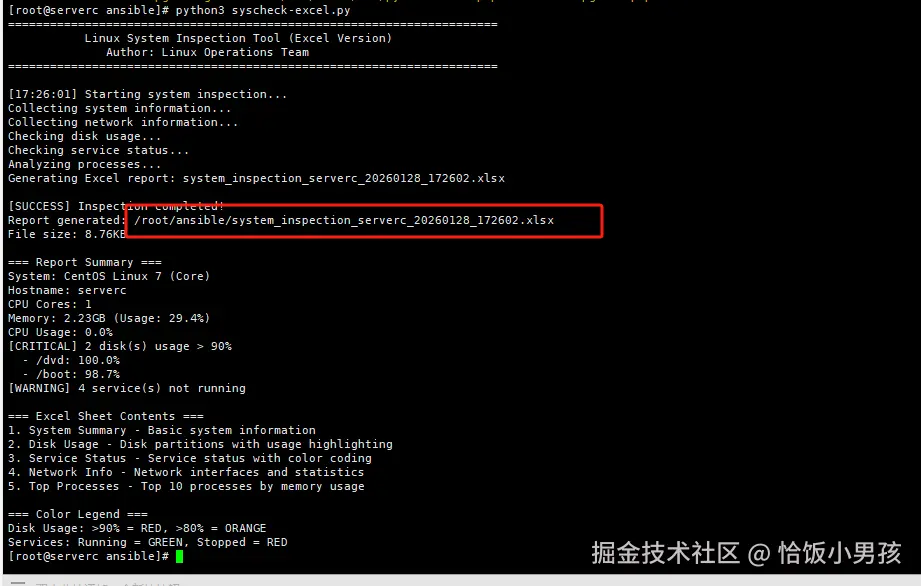
print(f"n[SUCCESS] Inspection completed!")
print(f"Report generated: {os.path.abspath(filename)}")
if os.path.exists(filename):
print(f"File size: {get_size(os.path.getsize(filename))}")
# 显示摘要信息
print("n=== Report Summary ===")
print(f"System: {system_info.get('OS Name', system_info.get('System', 'Unknown'))}")
print(f"Hostname: {hostname}")
print(f"CPU Cores: {system_info.get('CPU Cores (Logical)', 'Unknown')}")
print(f"Memory: {system_info.get('Total Memory', 'Unknown')} (Usage: {system_info.get('Memory Usage %', 'Unknown')})")
print(f"CPU Usage: {system_info.get('CPU Usage %', 'Unknown')}")
# 磁盘警告
if disk_info:
critical_disks = [d for d in disk_info if d['Percent'] >= 90]
warning_disks = [d for d in disk_info if 80 <= d['Percent'] < 90]
if critical_disks:
print(f"[CRITICAL] {len(critical_disks)} disk(s) usage > 90%")
for disk in critical_disks[:3]:
print(f" - {disk['Mount Point']}: {disk['Usage %']}")
if warning_disks:
print(f"[WARNING] {len(warning_disks)} disk(s) usage > 80%")
# 服务警告
if services:
failed_services = [s for s in services if s['Status'] in ['inactive', 'failed', 'error']]
if failed_services:
print(f"[WARNING] {len(failed_services)} service(s) not running")
print("n=== Excel Sheet Contents ===")
print("1. System Summary - Basic system information")
print("2. Disk Usage - Disk partitions with usage highlighting")
print("3. Service Status - Service status with color coding")
print("4. Network Info - Network interfaces and statistics")
print("5. Top Processes - Top 10 processes by memory usage")
print("n=== Color Legend ===")
print("Disk Usage: >90% = RED, >80% = ORANGE")
print("Services: Running = GREEN, Stopped = RED")
except Exception as e:
print(f"n[ERROR] Failed to generate report: {e}")
import traceback
traceback.print_exc()
def main():
"""主入口函数"""
print("=" * 70)
print(" Linux System Inspection Tool (Excel Version)")
print(" Author: Linux Operations Team")
print("=" * 70)
print()
try:
# 检查是否以root运行(某些信息需要root权限)
if os.geteuid() != 0:
print("[WARNING] Running without root privileges")
print("Some information (services, detailed disk info) may not be available")
print("Consider running with: sudo python3 syscheck-excel.py")
response = input("Continue anyway? (y/N): ")
if response.lower() != 'y':
print("Exiting...")
return
# 执行巡检
sys_check_excel()
except KeyboardInterrupt:
print("nn[INFO] Inspection interrupted by user.")
except Exception as e:
print(f"n[ERROR] Unexpected error: {e}")
import traceback
traceback.print_exc()
if __name__ == "__main__":
main()
python3 syscheck-excel.py
1、vim check_all.yml
- name: 全网服务器批量巡检
hosts: all
become: yes
gather_facts: yes
vars:
# 配置变量
check_script: "syscheck.sh"
report_dir: "./reports"
remote_report_dir: "/tmp"
tasks:
# 任务1: 创建本地报告目录
- name: 创建本地报告目录
delegate_to: localhost
run_once: yes
file:
path: "{{ report_dir }}"
state: directory
mode: '0755'
# 任务2: 分发巡检脚本
- name: 分发巡检脚本到目标服务器
copy:
src: /root/ansible/syscheck.sh
dest: /usr/local/bin/syscheck.sh
owner: root
group: root
mode: '0755'
# 任务3: 执行巡检并保存结果
- name: 执行系统巡检
shell: |
# 设置环境变量,禁用终端颜色
export TERM=dumb
/usr/local/bin/syscheck.sh
register: check_result
args:
executable: /bin/bash
environment:
TERM: dumb # 禁用颜色输出,避免ANSI转义字符
# 任务4: 保存巡检结果到临时文件
- name: 保存巡检结果
copy:
content: |
==========================================
服务器巡检报告
主机名: {{ ansible_hostname }}
IP地址: {{ ansible_default_ipv4.address | default('未知') }}
检查时间: {{ ansible_date_time.iso8601 }}
==========================================
{{ check_result.stdout }}
dest: "{{ remote_report_dir }}/check_{{ ansible_hostname }}.txt"
owner: root
group: root
mode: '0644'
# 任务5: 拉取巡检报告到本地
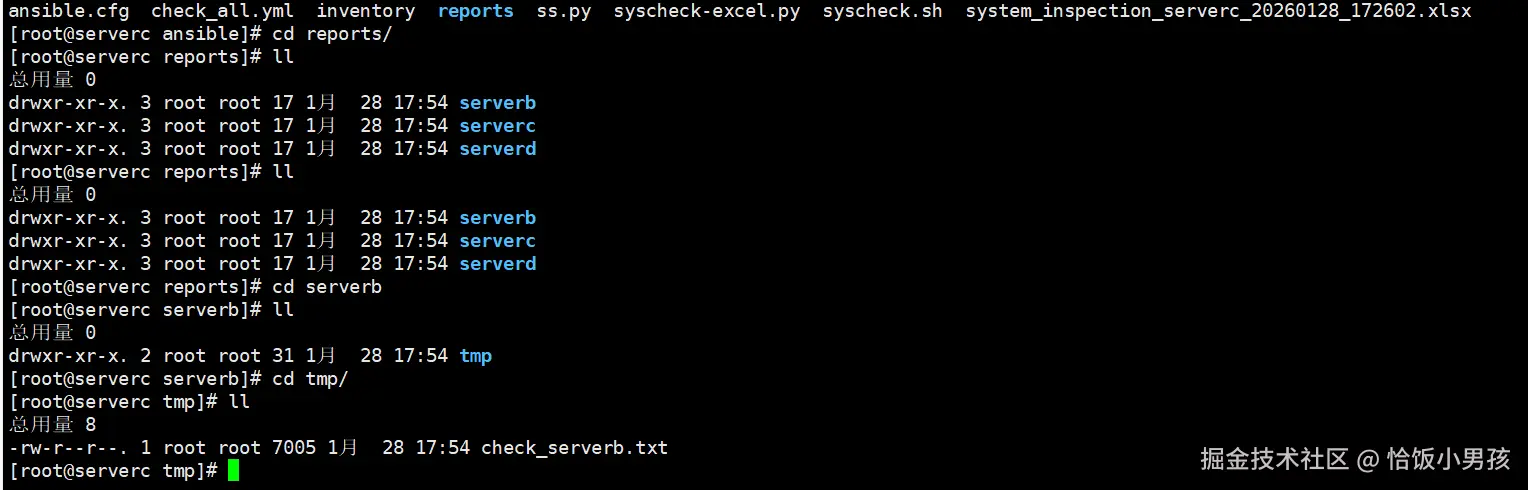
- name: 拉取巡检报告到本地
fetch:
src: "{{ remote_report_dir }}/check_{{ ansible_hostname }}.txt"
dest: "{{ report_dir }}/"
flat: no # 按主机名创建目录结构
# 任务6: 清理远程临时文件
- name: 清理远程临时文件
file:
path: "{{ remote_report_dir }}/check_{{ ansible_hostname }}.txt"
state: absent
# 任务7: 显示执行摘要
- name: 显示巡检摘要
debug:
msg: |
巡检完成: {{ ansible_hostname }}
报告已保存到: {{ report_dir }}/{{ ansible_hostname }}/check_{{ ansible_hostname }}.txt
1、ansible-playbook check_all.yml