

青灵
38.24M · 2026-03-07

最近粉丝咨询最多的问题莫过于 pxcharts 多维表是否能导出PDF的能力了。
说实话,我回避了很久。浏览器打印引擎差异大,中文渲染、分页断行、复杂表格适配...每个都是坑。
直到上个月,一个做财务的朋友跟我吐槽:月底导报表,调格式调到凌晨2点。我决定,这功能必须上。
于是在1周的设计和研究下,终于实现了多维表导出PDF的功能。
演示如下:
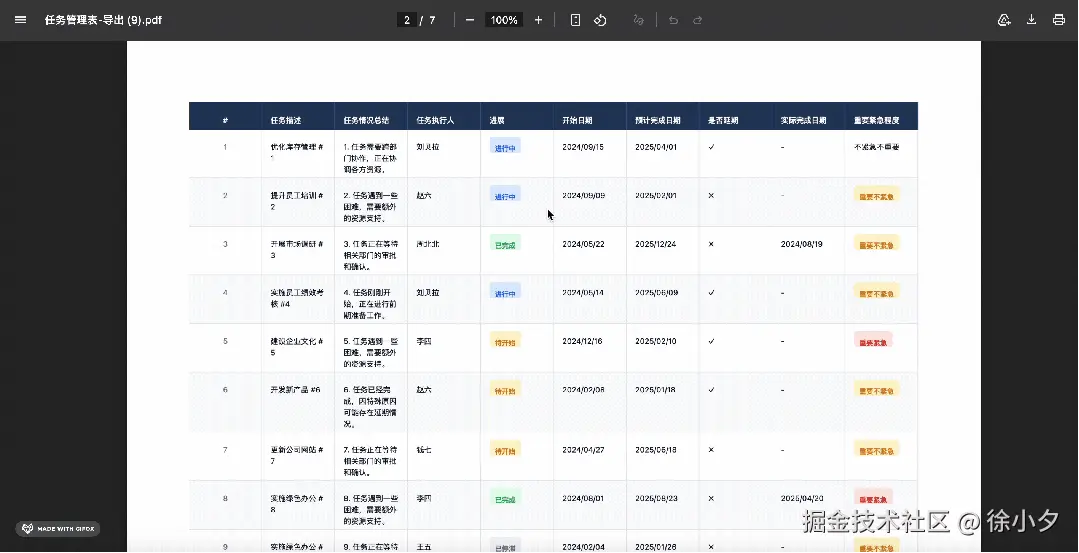
导出后的PDF文件预览效果:
演示地址:pxcharts.com
开源版:github.com/MrXujiang/p…
接下来和大家分享一下详细的功能技术实现。
支持将表格数据导出为 PDF 格式,便于用户打印、存档和分享,核心需求包括:
| 依赖 | 版本 | 用途 |
|---|---|---|
jspdf | latest | 生成 PDF 文件 |
html2canvas | latest | 将 HTML 渲染为 Canvas 图像 |
为什么选择 html2canvas + jsPDF?原因如下:
为什么不直接用 jsPDF 的表格 API?
autoTable 插件对复杂样式支持有限表格数据
↓
生成 HTML(按页)
↓
html2canvas 渲染为 Canvas
↓
Canvas 转 PNG 图像
↓
jsPDF 写入 PDF(每页一张图)
↓
下载 PDF 文件
关键问题:如何避免表格行在分页时被截断?
我的解决方案:按行预分页
rowsPerPage = floor((pageHeight - headerHeight) / rowHeight)const estimateRowHeight = 36// 每行大约 36px
const headerHeight = 60// 表头高度
const pageContentHeightPx = Math.round(contentHeight / scale)
const rowsPerPage = Math.floor((pageContentHeightPx - headerHeight) / estimateRowHeight)
// 分页
for (let i = 0; i < records.length; i += rowsPerPage) {
const pageRecords = records.slice(i, i + rowsPerPage)
pages.push(renderDataPage(pageRecords, i))
}
const [{ default: jsPDF }, { default: html2canvas }] = awaitPromise.all([
import("jspdf"),
import("html2canvas"),
])
原因:jspdf 和 html2canvas 依赖浏览器 API(如 document、window),在 Next.js SSR 阶段会报错。使用动态导入确保只在客户端执行。
const pageDimensions = {
a4: { width: 595, height: 842 },  // pt 单位
a3: { width: 842, height: 1191 },
}

const pdfWidth = orientation === "landscape"
  ? pageDimensions[pageSize].height
  : pageDimensions[pageSize].width
注意:jsPDF 使用 pt(点)作为单位,1pt = 1/72 英寸。
数据页结构这里我预设如下:
<divstyle="width:1122px;padding:32px;box-sizing:border-box;background:#fff">
<tablestyle="width:100%;border-collapse:collapse">
<thead><!-- 表头 --></thead>
<tbody><!-- 数据行 --></tbody>
</table>
</div>
关键样式:
width:1122px固定 canvas 宽度(A4 横向像素)border-collapse:collapse合并表格边框white-space:nowrap防止文本换行const canvas = awaithtml2canvas(element, {
scale: 2, // 2倍缩放,提高清晰度
useCORS: true, // 允许跨域图片
allowTaint: true, // 允许污染 canvas
backgroundColor: "#ffffff",
logging: false,
})
参数说明:
| 参数 | 说明 |
|---|---|
scale: 2 | 2倍分辨率,PDF 更清晰 |
useCORS | 处理跨域图片(如附件预览图) |
allowTaint | 允许 canvas 被污染(某些图片需要) |
const imgData = canvas.toDataURL("image/png", 1.0)
const imgWidth = contentWidth
const imgHeight = (canvas.height * imgWidth) / canvas.width

pdf.addImage(imgData, "PNG", margin, margin, imgWidth, imgHeight)
图像格式选择:
constcolorMap: Record<string, string> = {
"已完成": "#dcfce7;color:#16a34a",
"进行中": "#dbeafe;color:#2563eb",
"待开始": "#fef3c7;color:#d97706",
"已停滞": "#f3f4f6;color:#6b7280",
"重要紧急": "#fee2e2;color:#dc2626",
}
<tr style="background:${idx % 2 === 0 ? "#fff" : "#f8fafc"}">
// 方案1:省略号截断(适合固定宽度列)
<span style="overflow:hidden;text-overflow:ellipsis;white-space:nowrap;max-width:160px">

// 方案2:完全显示(适合自动宽度列)
<spanstyle="white-space:nowrap">
当然还有很多细节的处理,这里就不一一介绍了。我们可以基于这个方案,继续扩展出如下场景:
今天就分享到这,后续我们还会持续迭代和更新,打造最强大的多维表格和文档协同系统。
演示地址:pxcharts.com
开源版:github.com/MrXujiang/p…